Using Holographic Displays to aid Material Science Tomographic Data Visualization
By Jacob Pietryga
Editing: Carolyn Giroux, Talal Alothman
Understanding a 3D object without being able to actually see a 3D object is one of the earliest hurdles a student faces when studying Materials Science and Engineering (MSE). I remember taking my introductory MSE 250 course, where concepts like Miller Indices, Bravais Lattices, and dislocation structures baffled students for weeks on end. Our innate sense of 3D in everyday life did little to help us visualize these crucial MSE concepts.
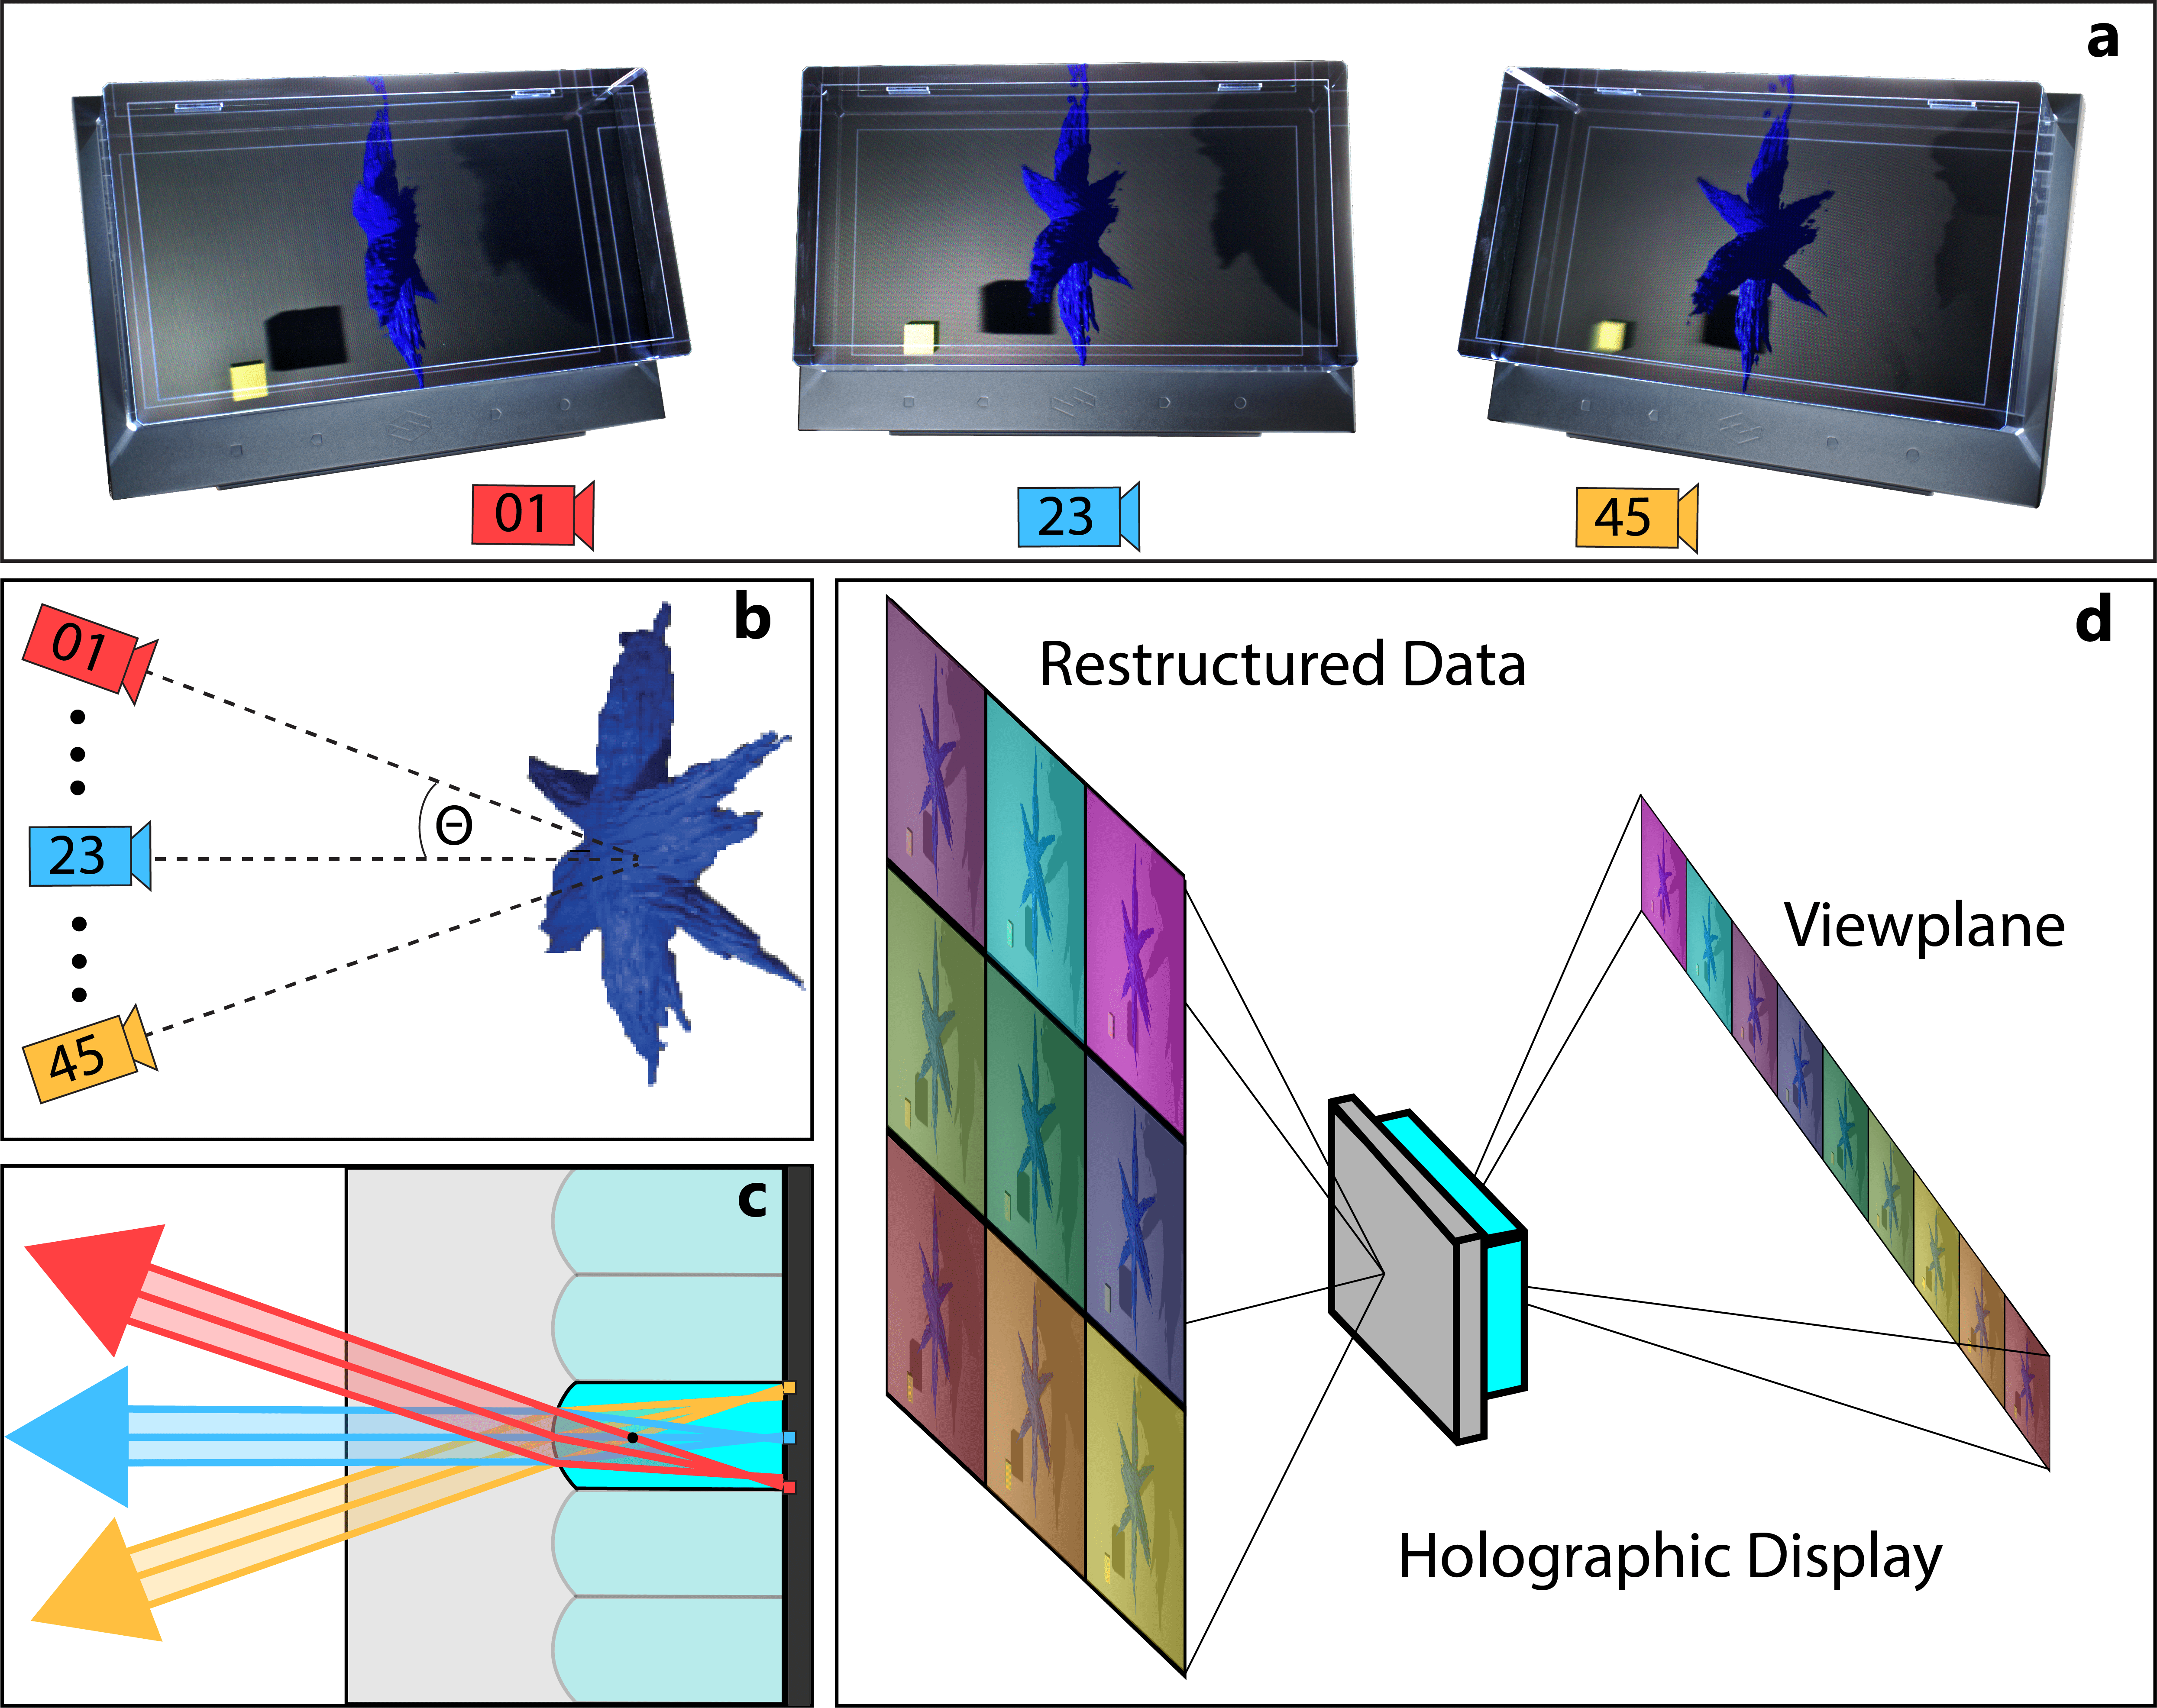
Additionally, being able to rapidly analyze and interact with complex 3D datasets is a massive interest in atomic, macro, and meso-scale materials science, and it can prove challenging for even the most experienced researchers. This problem has motivated many groups to pursue more immersive ways of showcasing 3D, namely through the use of augmented, virtual, and mixed reality (XR) and holographic tools. When I joined Professor Robert Hovden’s group as part of the SURE program, I had my chance to finally work on a project funded by UM’s XR Clinic: the holographic display. The project started simple: understand how the LookingGlass holographic display worked and use it with some electron tomography data. LookingGlass provides an API (application programming interface) that can take a series of images focused on an object and transform them into a limited-range light-field, yielding a clear process for turning 2D images into 3D holographic visualizations (Figure 1) [Frayne].

Figure 1 | STEM tomography of hyperbranched Co2P particle pipeline on holographic display [Levin]. (A) Visual representation of the multiview display observed from extreme angles. Depth information is conveyed through lighting and shadows as well as relative position and size [Goldstein,Lovell]. (B) Usage of holographic displays begins with generating 45 unique views focused on a point on the sample. The maximum viewing semi-angle Ɵ is ~22°. (C) A single cylindrical lens’s ray diagram shows how pixels project to viewing angles. (D) A holographic display projects distinct images into certain view regions along a viewplane. A viewer will perceive an image on the holographic display based on their position along the viewplane.
In the next stage of the project, we focused on how we could take the holographic display from a neat but limited viewing tool to something beneficial for students and researchers. In collaboration with Talal Alothman (the XR Clinic’s XR developer) we utilized Unity to create a model loader to allow the LookingGlass display to work in tandem with Leap Motion Hand Trackers (Supplemental Video). This allowed students and researchers to interact with the display using more natural hand motions instead of a mouse and keyboard. We then worked on using the holographic display hardware to create quick 3D visualizations from electron micrographs, providing a method for researchers to preemptively inspect a specimen and adjust scientific objectives before committing to a more rigorous tomography experiment.
In summary, holographic displays represent an alternative way of presenting 3D nanoscale materials that is more familiar and intuitive for humans’ 3D perception. I believe they are a fantastic case study for how novel forms of XR tools can be used by both educators and researchers, especially because holographic displays allow for interaction with 3D images without the use of a head-mounted display and allow for group viewing. Further work is needed to verify how the displays may benefit students and researchers alike, but I am excited to see where this work will go in the future.
Citations
Frayne, S. Fok, Y.T., Lee, S.P. (2019). Superstereoscopic display with enhanced off-angle separation (U.S. Patent No. 10298921) U.S. Patent and Trademark Office. https://patents.justia.com/patent/10298921
Levin, Barnaby, et al. (2016). Nanomaterial datasets to advance tomography in scanning transmission electron microscopy. Scientific Data. 3. 160041.
Goldstein, E.B. (1989). Sensation and Perception, 3rd ed. Belmont, CA: Wadsworth
Lovell, P. G., Bloj, M., Harris, J. M.. (2012). Optimal integration of shading and binocular disparity for depth perception. Journal of Vision;12(1):1
